
Overthinking Hockey Shift Age
Deep dive into how hockey shift age impact shots and goals early in the 2025-26 season

Shifts are one of the elements that make hockey so unique. Skaters (players who don’t play goalie) don’t stay the entire game on the ice. Instead, they play extremely short shifts that can last between 0 and (usually) 90 seconds before going back to the bench to relax. In a normal NHL game, the most used skaters will have played around 25 minutes while some of their teammates will have stayed under 10 minutes of time on ice. In today’s piece, I push you to overthink over one of the fundamentals of hockey: shifts. In the next lines, I, unfortunately, don’t make a breakthrough finding, but I unpack some elements that help to confirm some evidences. At the end of the blog, you will be an expert at analyzing shifts. And you will have cool things to tell your family and friends at the Christmas dinner table. I scraped the first 26% of NHL games this season and analyzed players shifts on your behalf. Before we move forward, note that the analysis is about the shifts of all the skaters (forwards and defensemen), not about the a specific player (like the shooter). Bon appétit!
When are Goals Scored?
When you are chosen by the public (NHL) hockey analytics gods to do research for them, you learn early that shots are the oil of the research. You might want to avoid it, but at some point, it is omnipresent in hockey research. Playing with public datasets is fun, but it often comes with drawbacks. NHL data has a lot of limitations for analysis (this is why we all need to be a bit careful). In the field of public NHL analytics, defense is defined as aggregated sum shot quality against a team/player/group of players (known as Expected Goals Against — xGA) while offense is usually the aggregated sum shot quality generated by a team/player/group of players (known as Expected Goals For — xGF). It is a bit problematic, yes, but I promised you I would talk about Shift Age earlier, so let me get back to my initial train of thought. If I made an extremely long (probably too long) discourse to introduce the concept of shots in hockey research, it is to justify why I will include shots and goals in the analysis.
At first, when I decided I would dig into Shift Age, I first wondered about how old are the shifts when goals happen.
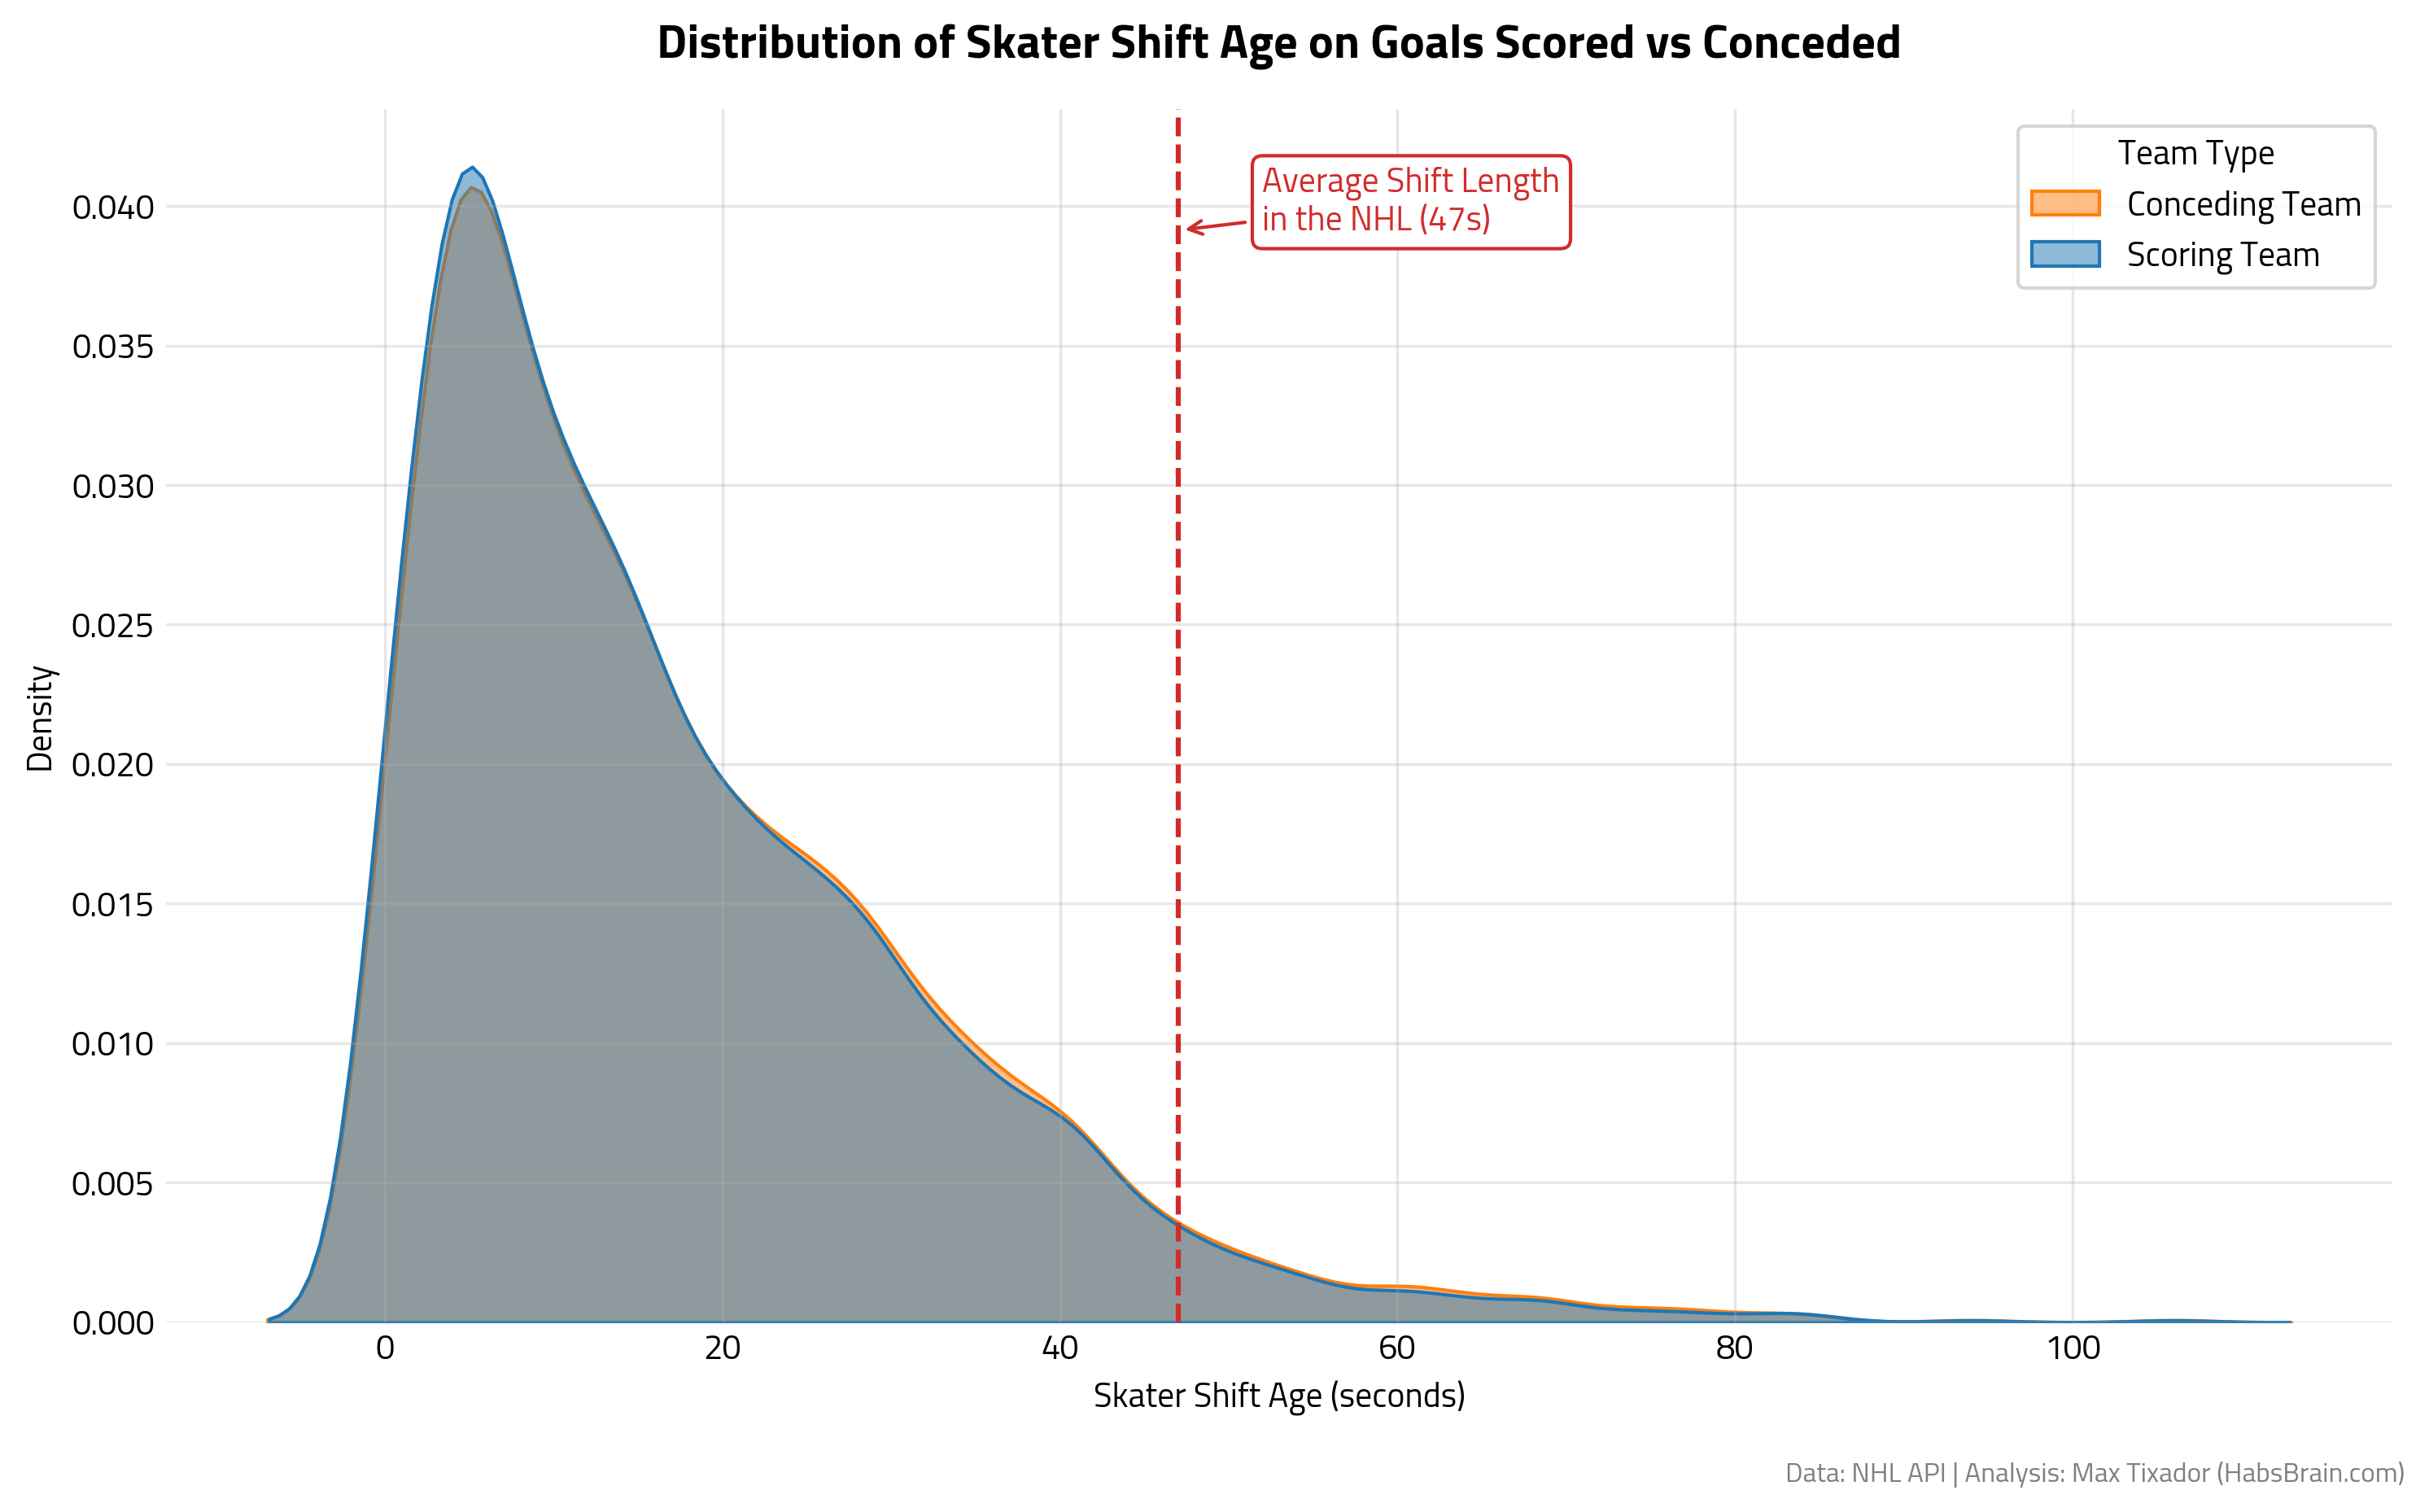
In this figure, we can understand that goals are scored when players are still fresh. It makes sense considering that goals are generally scored by quick plays, quick transitions, and don’t require complex buildups. What’s more interesting is to see that the distributions covered by the Scoring and Conceding team are overlapping, suggesting that goals scored because of a Shift Age advantage are rare. In other words, this reflects that coaches do a good job at preventing getting scored on because the other opposing team got fresh players against an already tired group. So, even if fatigue (accrued player shift age) does occur, it does not explain a lot of goals against.
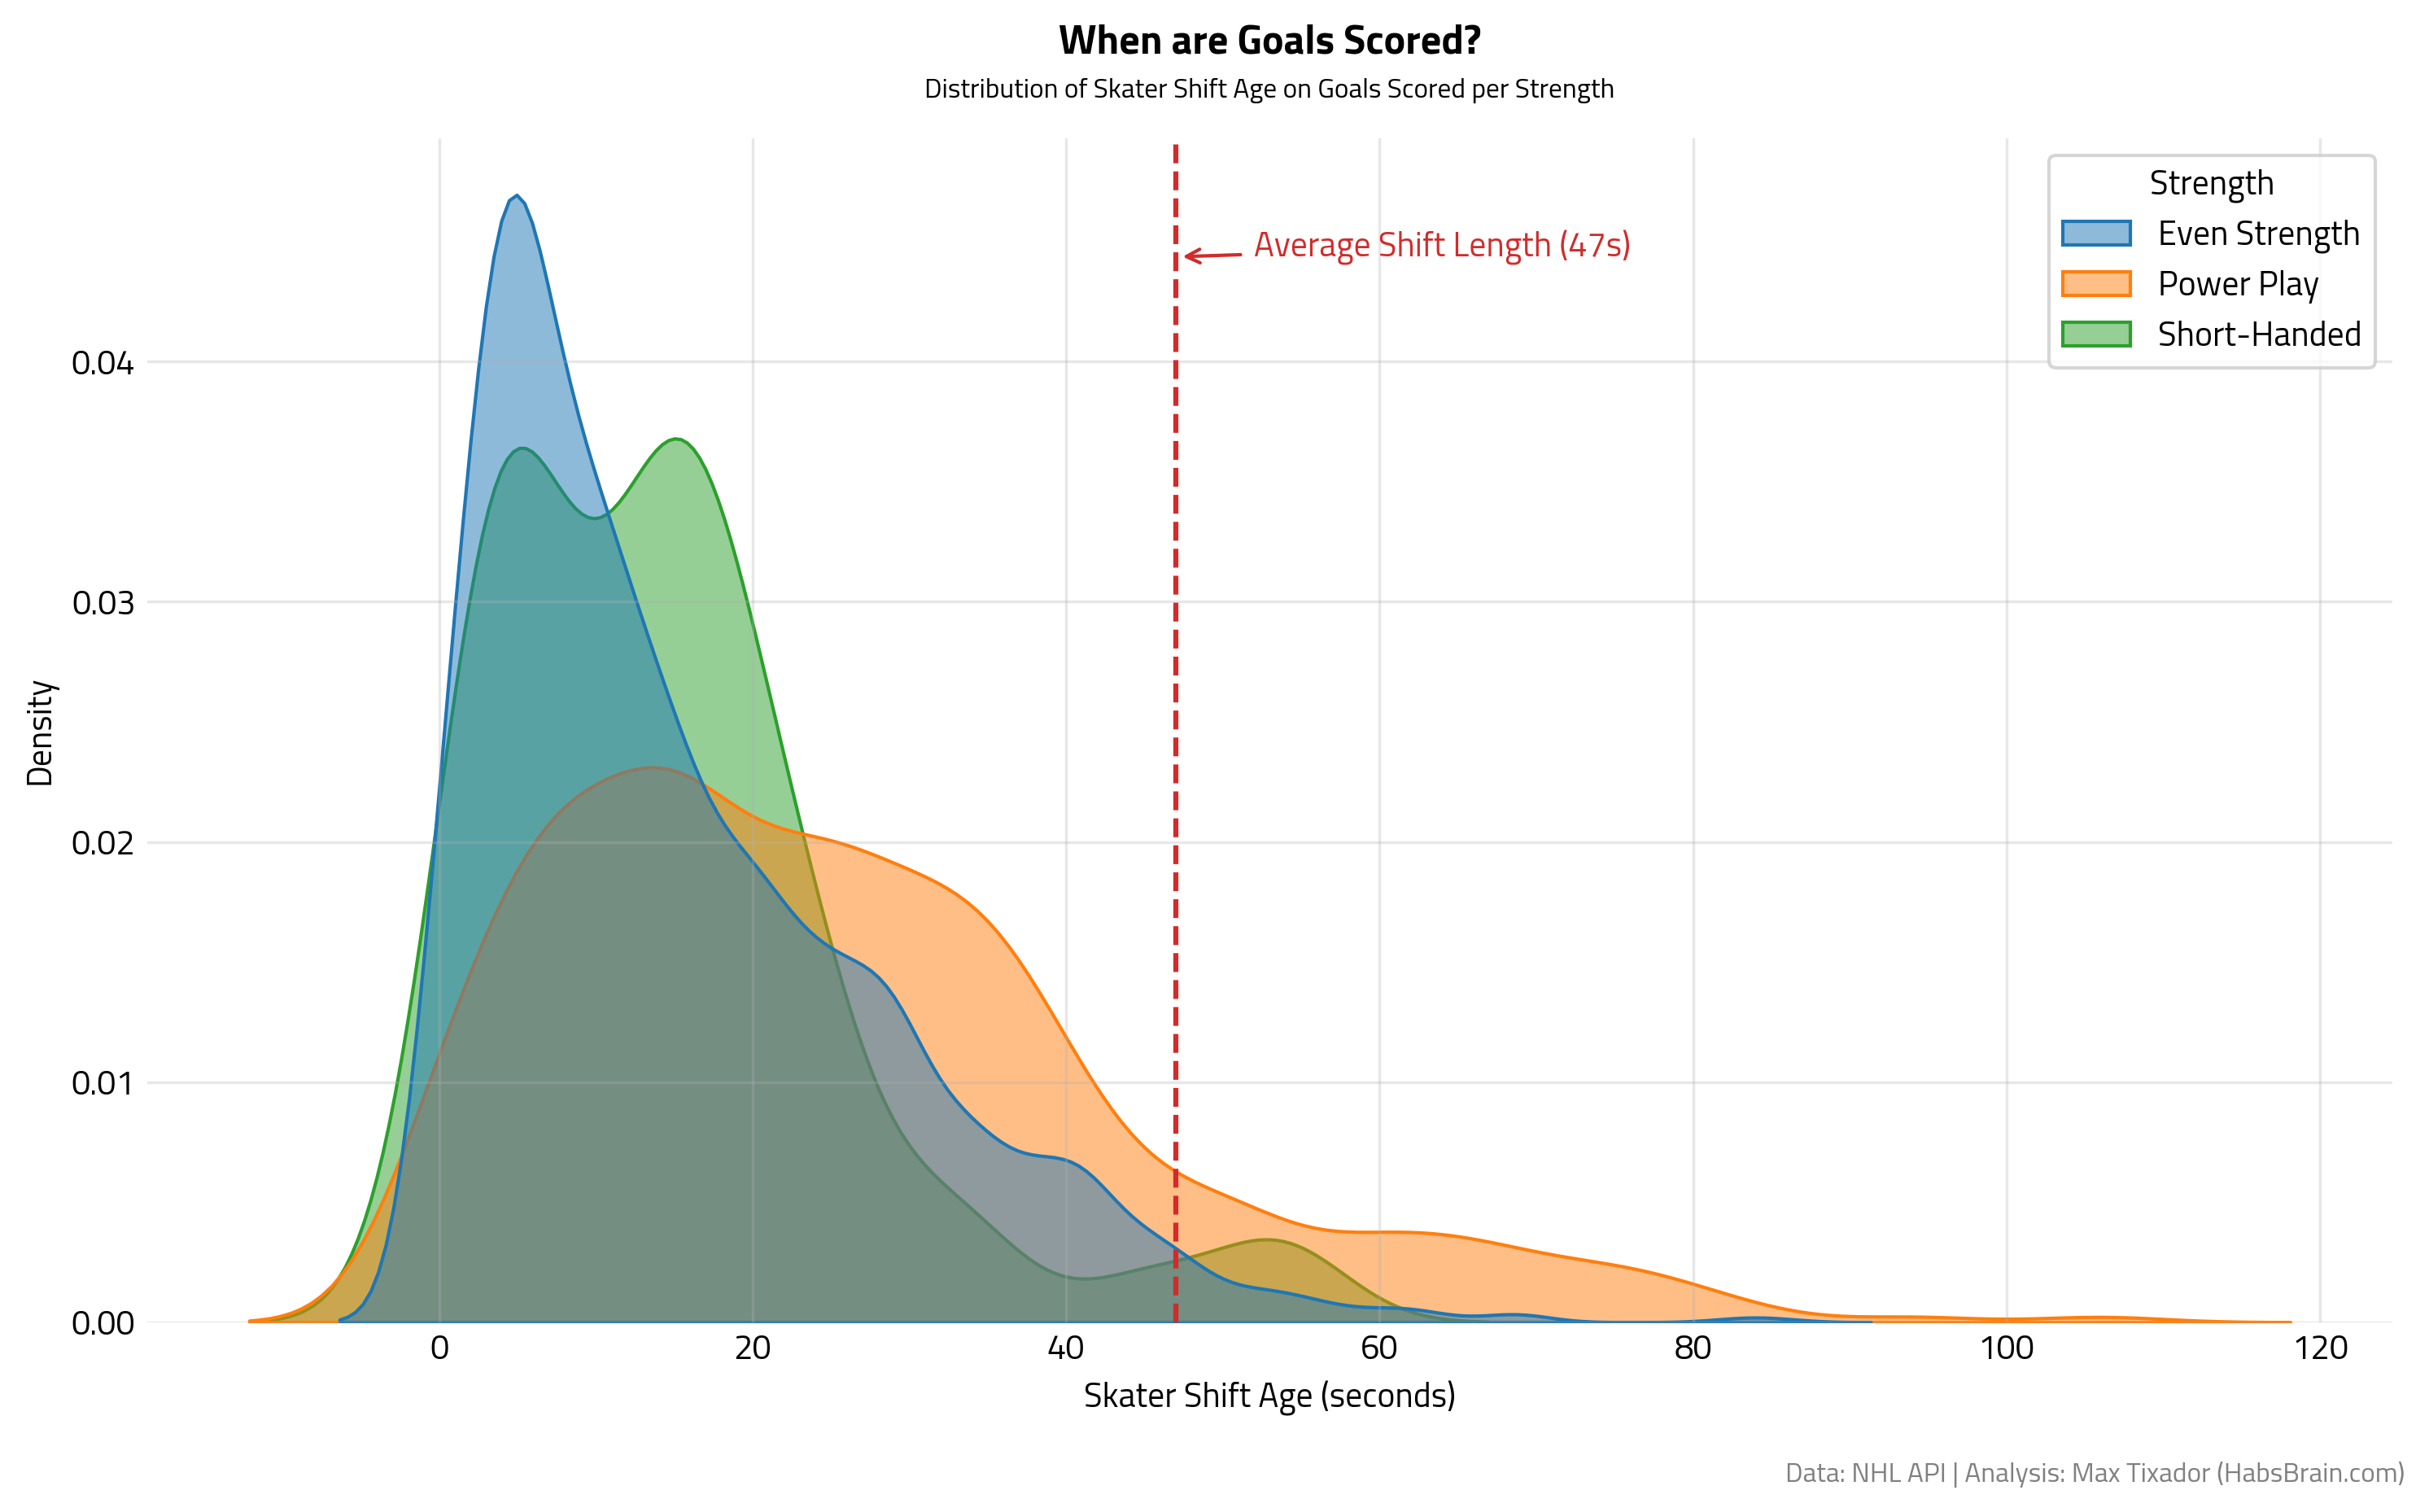
It gets much more captivating when we compare by game strength. Even if goals are still scored early in players shifts, goals on PP take more time to prepare. Teams generally take their time pass the puck to open up passing lanes to find a trigger player to get the optimal shot. I don’t want to put too much stock on Short-handed Goals, but it is still insightful to see that they are scored early in the shift. Ideally, the SH shifts are shorts and a player with a long SH shift is more likely to want to want to rush to the bench instead of scoring a goal. It is also important to note that scoring a goal is almost never the main objective when a team is shorthanded, so the sample size of goals is really small compared to the other strengths, so the results are not really significant.
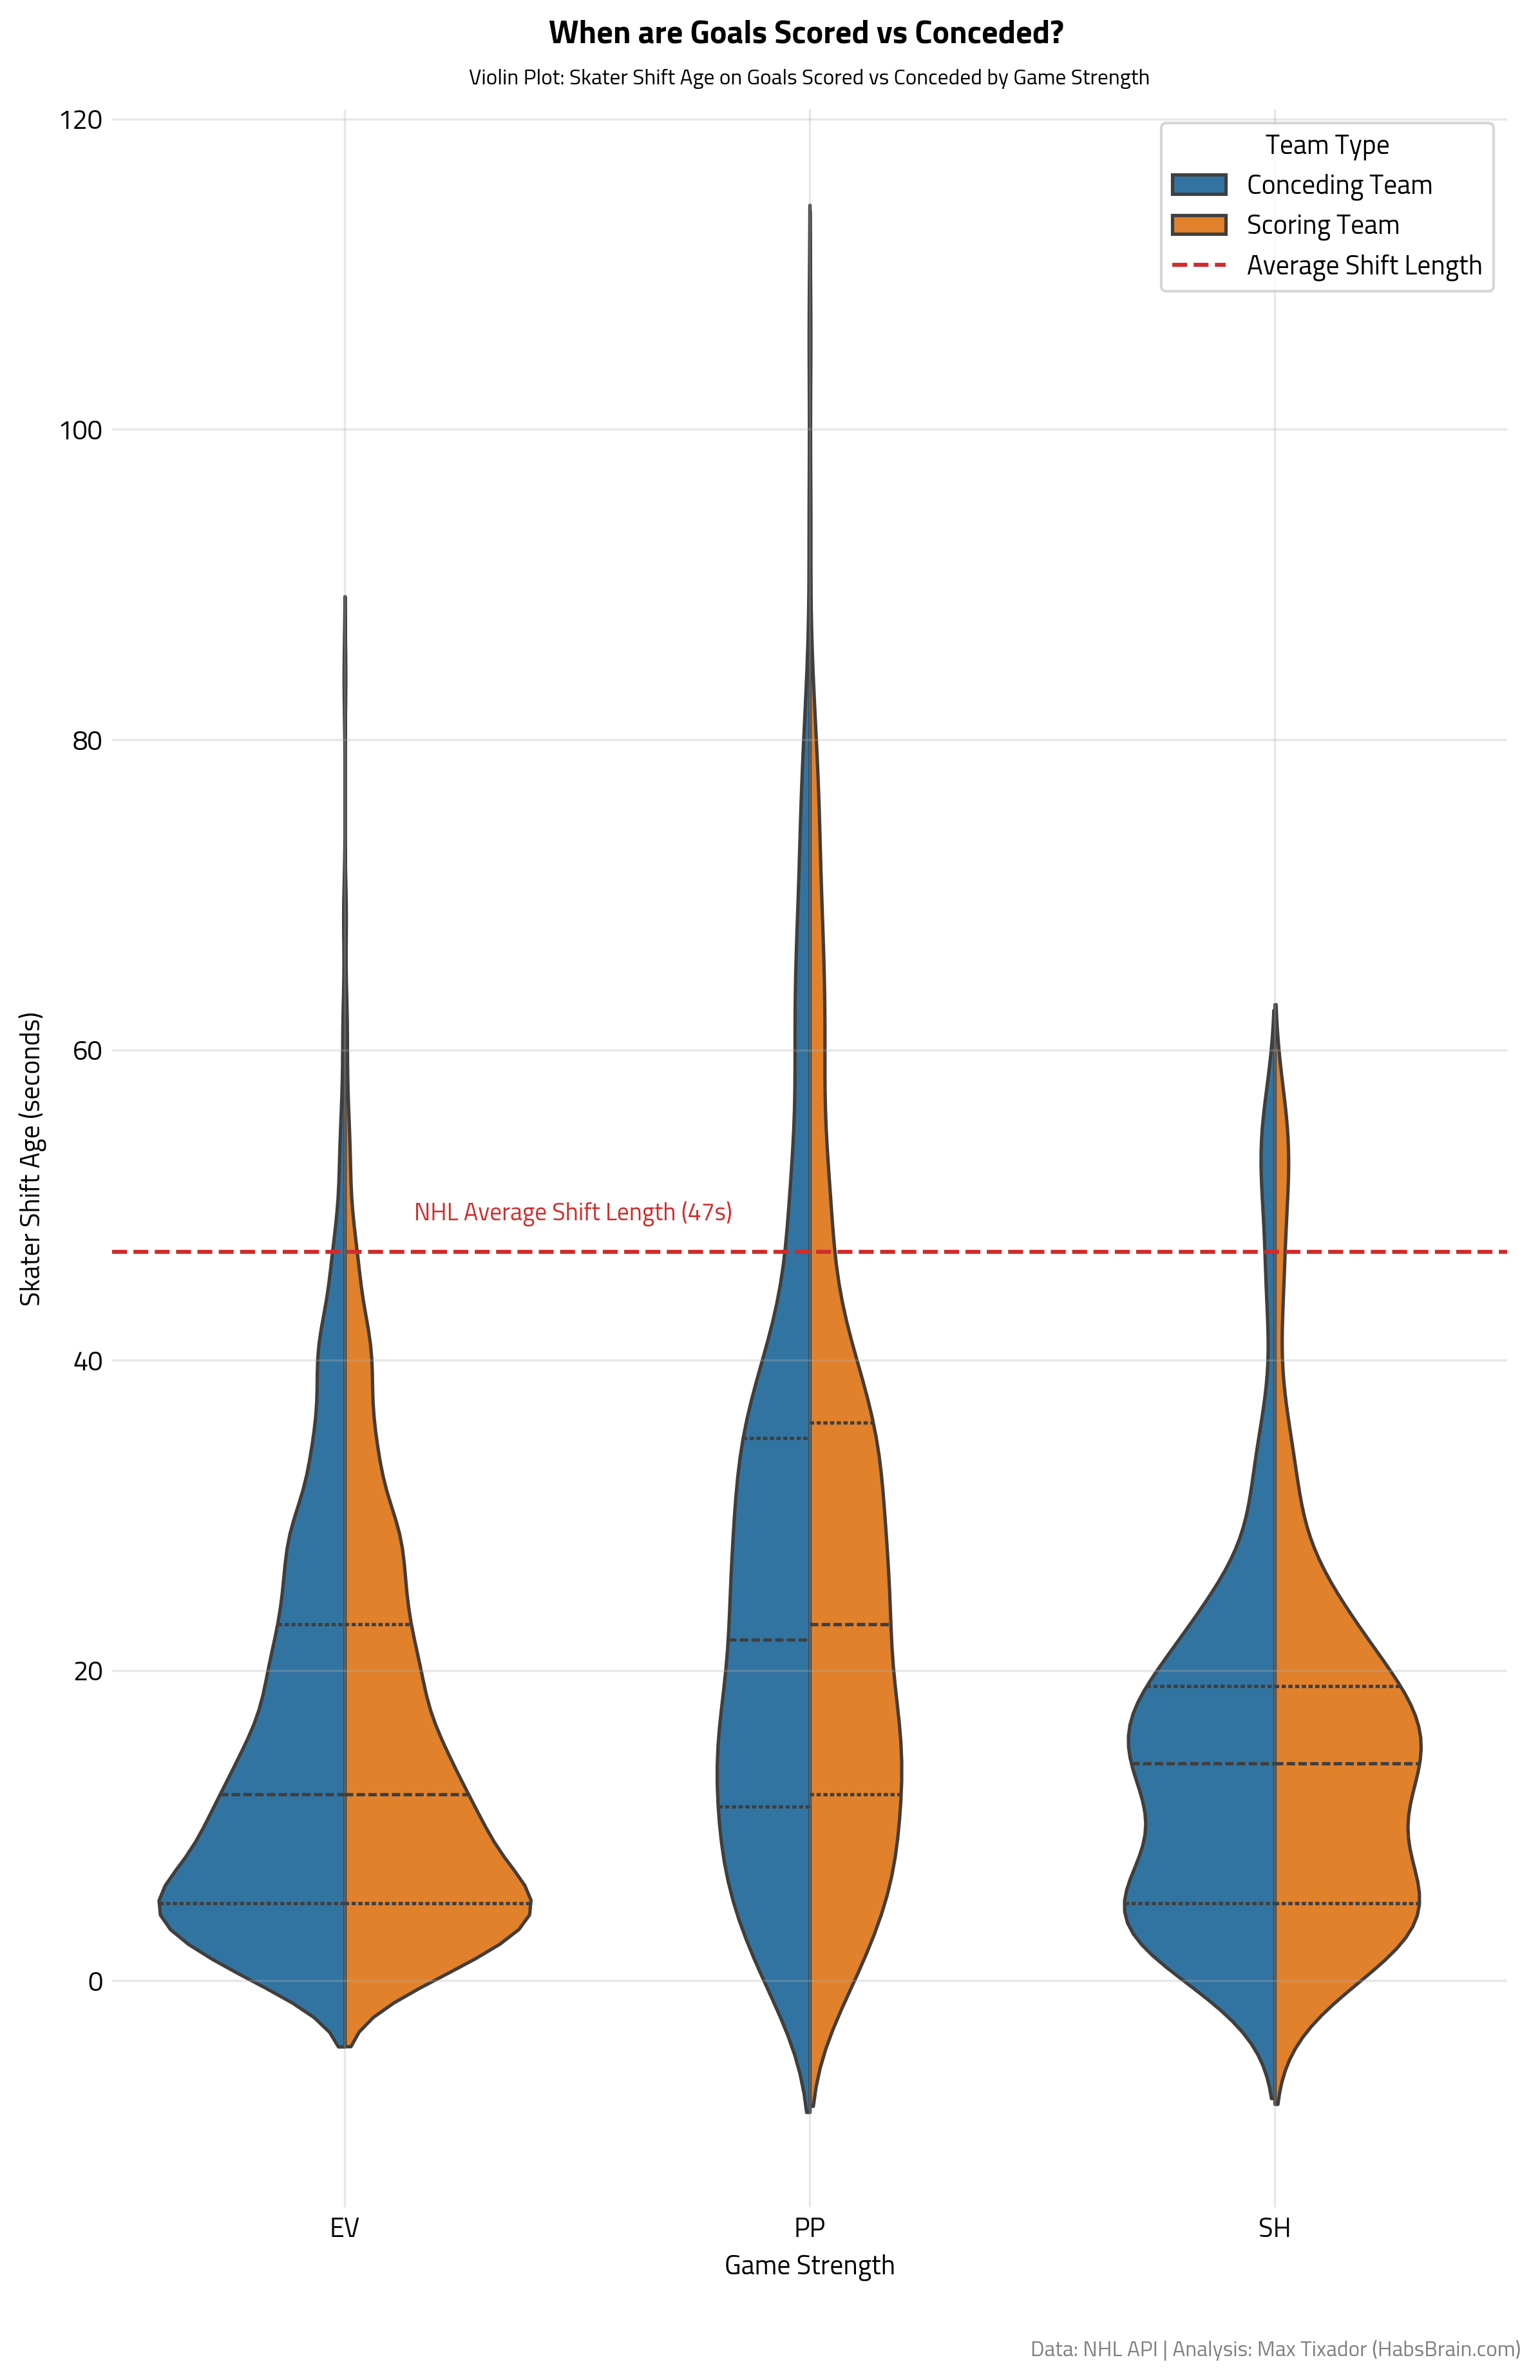
This comparative violin plot summarizes all the findings we made earlier and gives us an even more comprehensive perspective on the relationship between Goals Scored/Conceded, Shift Age, and Game Strength. Again, it is striking how, when goals do occur, they tend not to occur at extreme shift ages. Did you notice too how the lengths of the violins are different? The EV violin stops around 90s, PP near 120s, and SH closer to 60s. This teaches us something compelling about hockey: the point within a shift at which goals happen varies depending on game context. When goals are scored, Power Play shifts tend to be much older, Short-handed shifts are very young, and Even-Strength shifts fall somewhere in the middle.
What About the Shot Attempts?
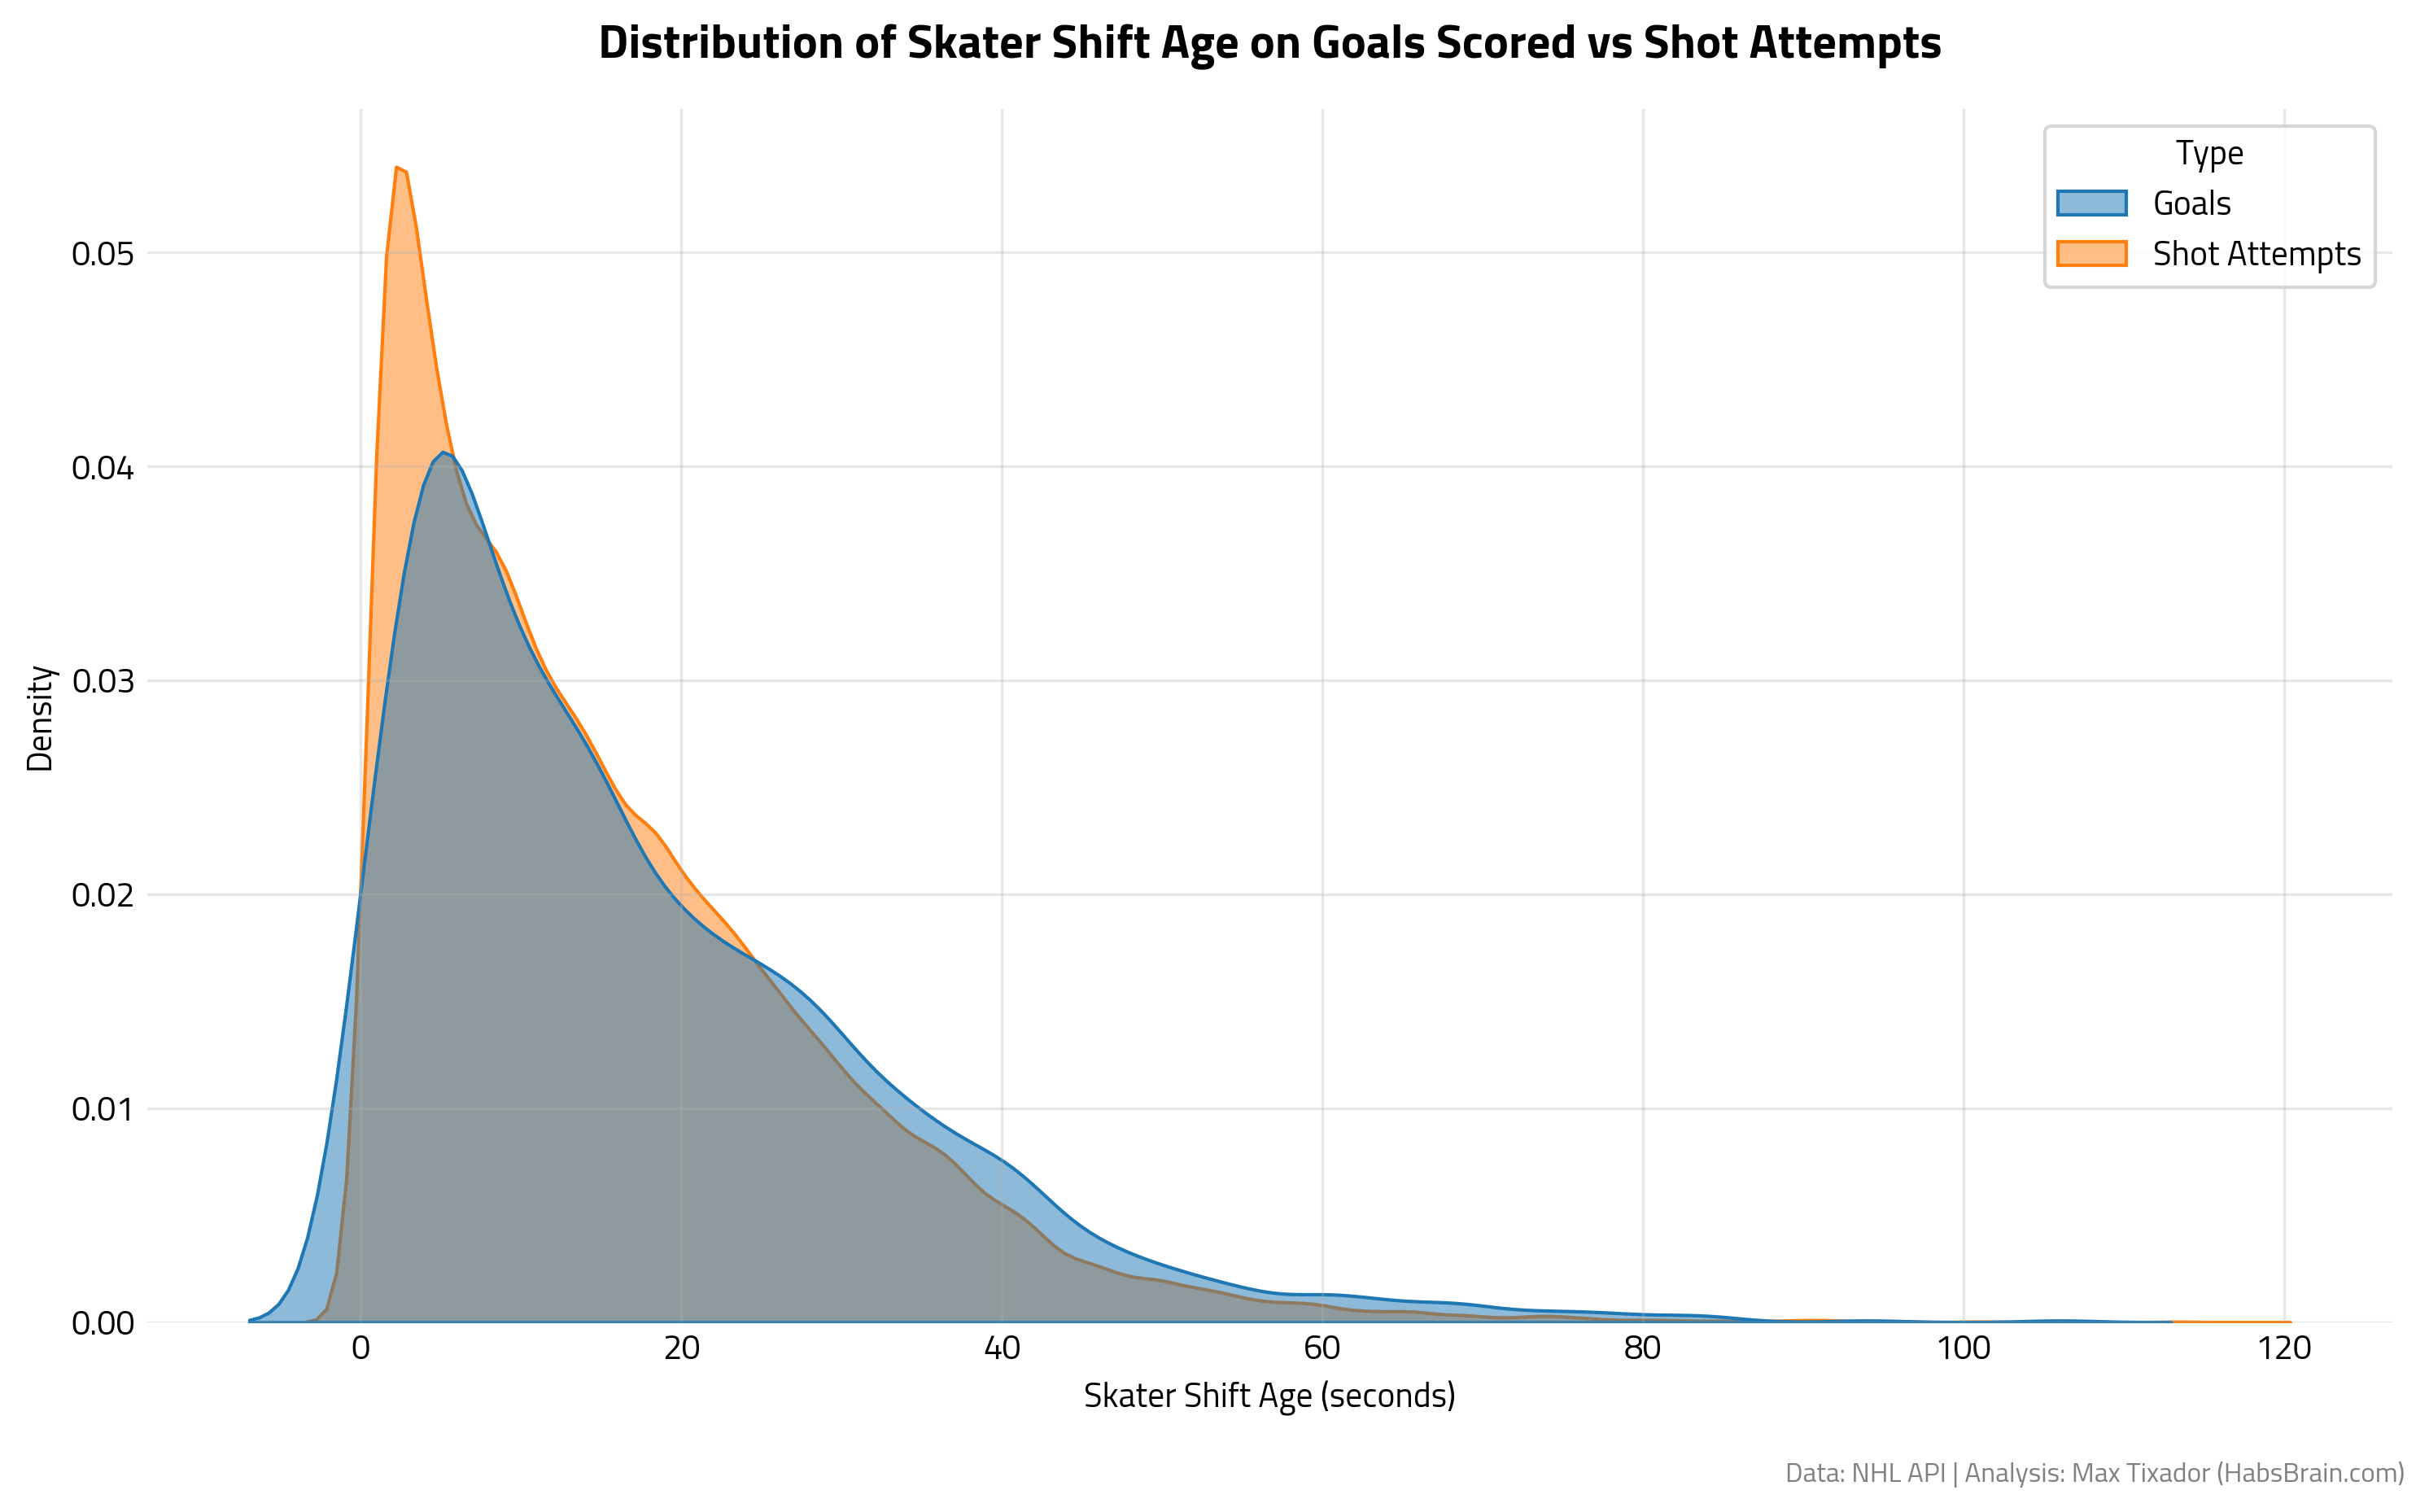
The first layer of the analysis is done. We looked at goals. Now, let’s dig into the analytics-doubters favourite hockey statistic : Corsi. It is also called shot attempts. Not a big surprise that the Shift Age distribution for Goals is extremely similar to the Shot Attempts’. Goals are not happening in those “fatigue moments”. This graph reflects that Goals and Shot Attempts behave similarly in this context. Finally, being a fresh player is not only important off the ice. Teams shoot and score more when they have fresh players on the ice. I don’t want to overwhelm you with charts, so I won’t show it here, but the distributions for Goals and Shot Attempts Conceded are almost identical to the ones you see up here. So, the conclusions are similar.
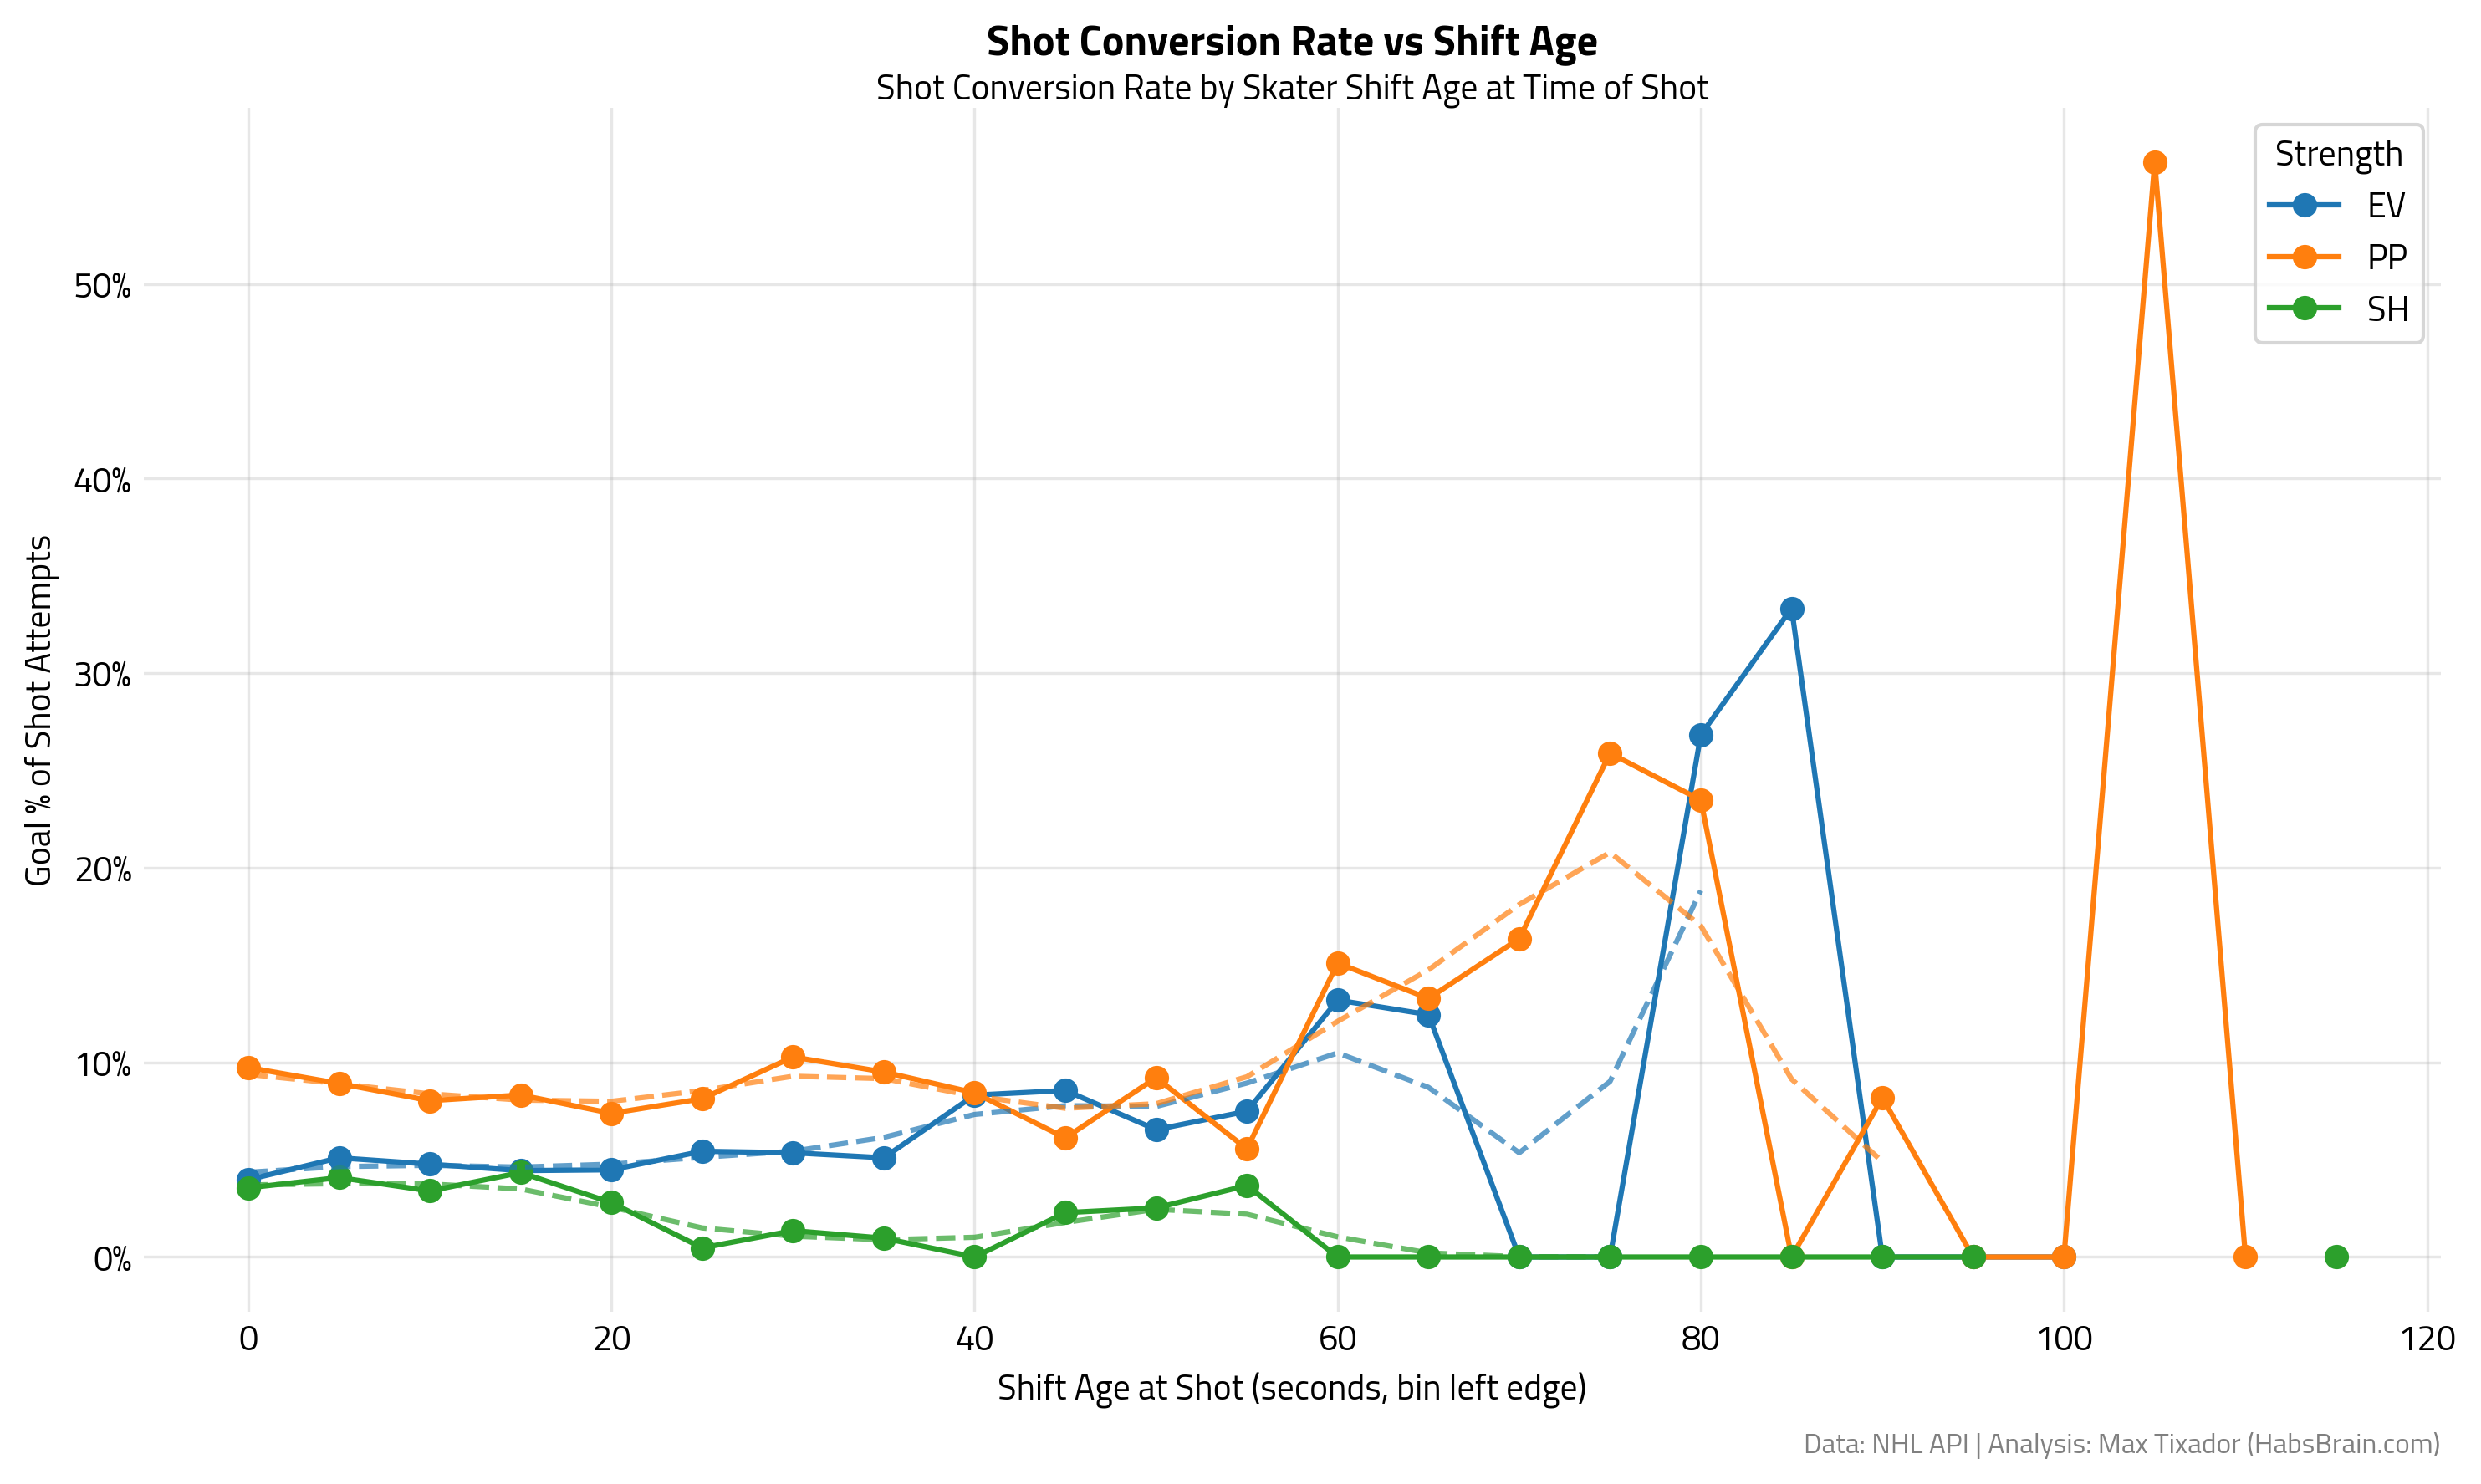
When we have Shot Attempts and Goals, and we divide one by the other, we get a really fun metric: Shot Conversion. The research is finally becoming fun! Shot conversion at EV and PP is quite stable until it reaches the 60s bin, where we see a significant rise. It is important to note that 60s is longer than the average NHL shift, so seeing a notable change in shot conversion at this key point raises questions. I wonder if this could be due to a goalie losing focus or defensive breakdowns after sustained pressure (both ideas would require additional research and are not in the scope of this blog), or a pattern where the offensive team is getting better looks late in shifts. Short-handed results, once again, don’t tell much.
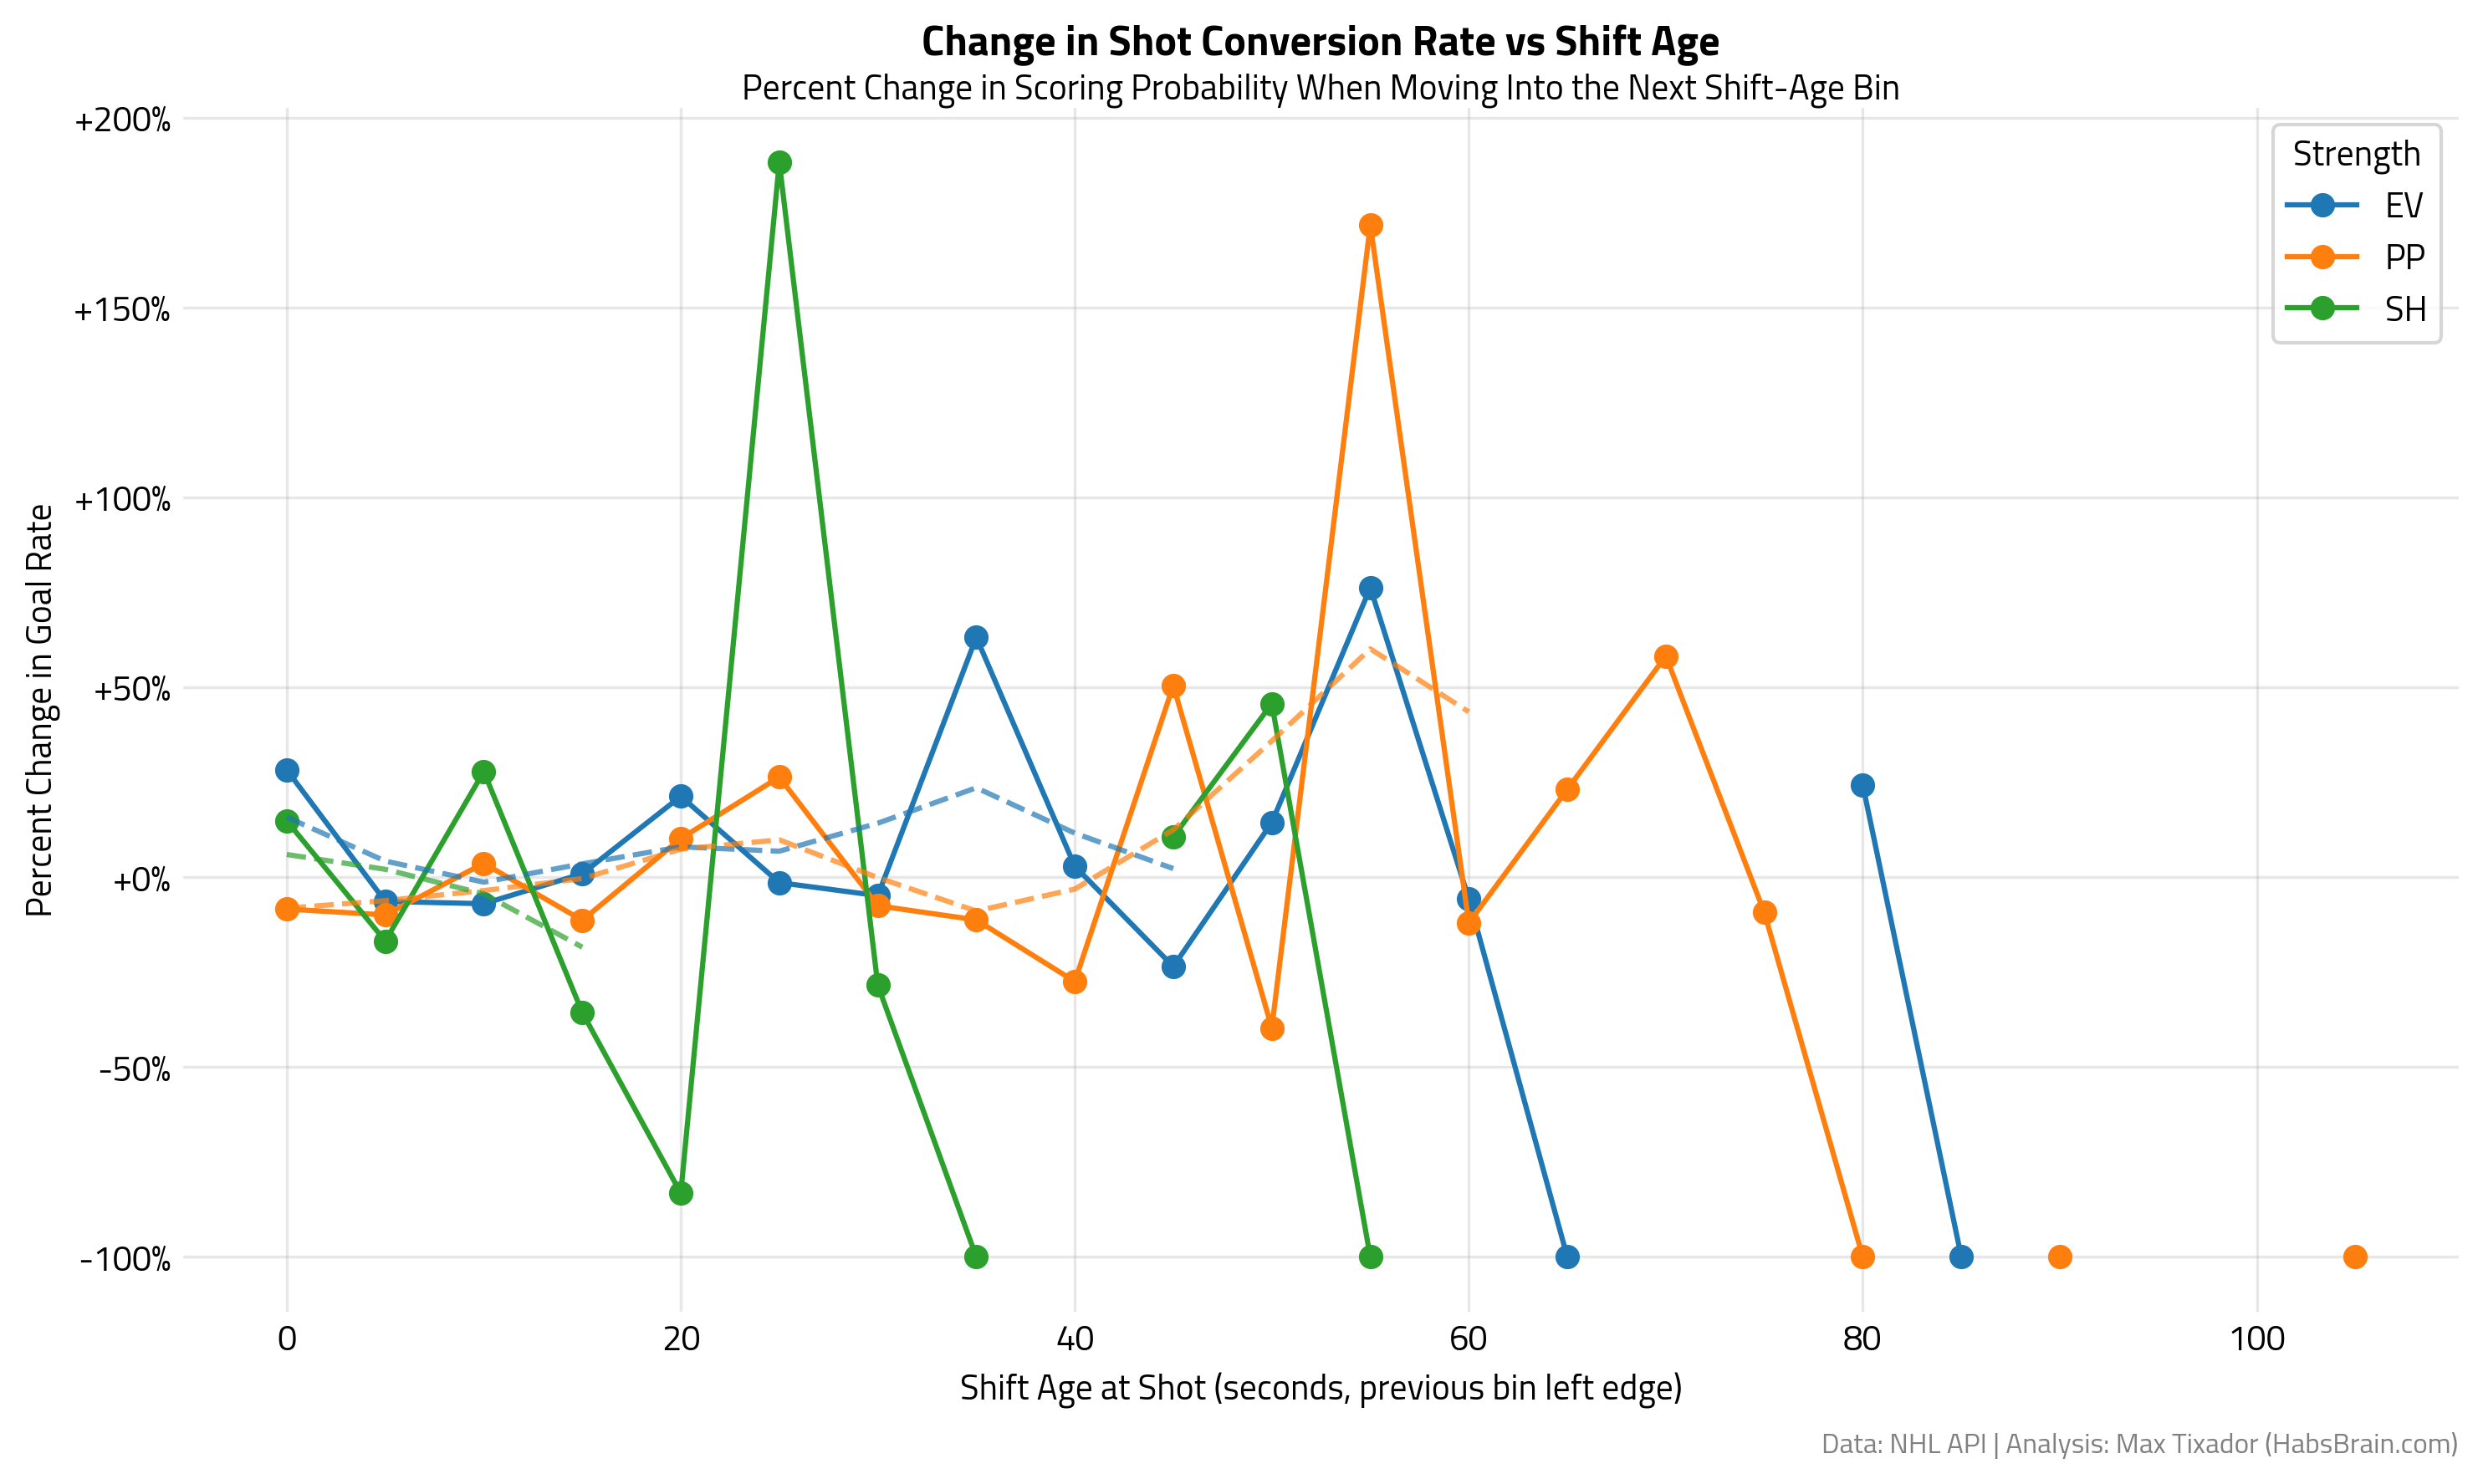
Looking at the % change of shot conversion from the previous bin, we can build more confidence that shots conversion is higher at the end of longer shifts. There is maybe a new variable to include in your expected goals model!
The Fatigue Factor, is it real?
For the last chunk of this article, let’s end with a bang! We want to analyze how often goals are scored (or conceded) by players who are on long shifts, and comparing the scoring team vs. the conceding team.
For that, I set thresholds every 10s starting at 20. For each threshold, I measured:
P(scoring shift ≥ T) = probability a goal was scored by a team whose skaters were on a long shift (≥ T seconds)
P(conceding shift ≥ T) = probability a goal was conceded by a team whose skaters were on a long shift
Then, I defined the Fatigue Factor using this formula :
This fatigue factor is a number between -1 and +1 that will tell us what is the cause of the goal at a T threshold. In layman terms, we can calculating which team (scoring or conceding) had the LONGER shifts at the time of goal?
Positive values ( > 0 ) suggest scoring team more often has long shifts, so a “Pressure Goal”. In opposition, negative values ( < 0 ) suggest the conceding team had the longer shift and the goal was a “Fatigue/Breakdown Goal”.
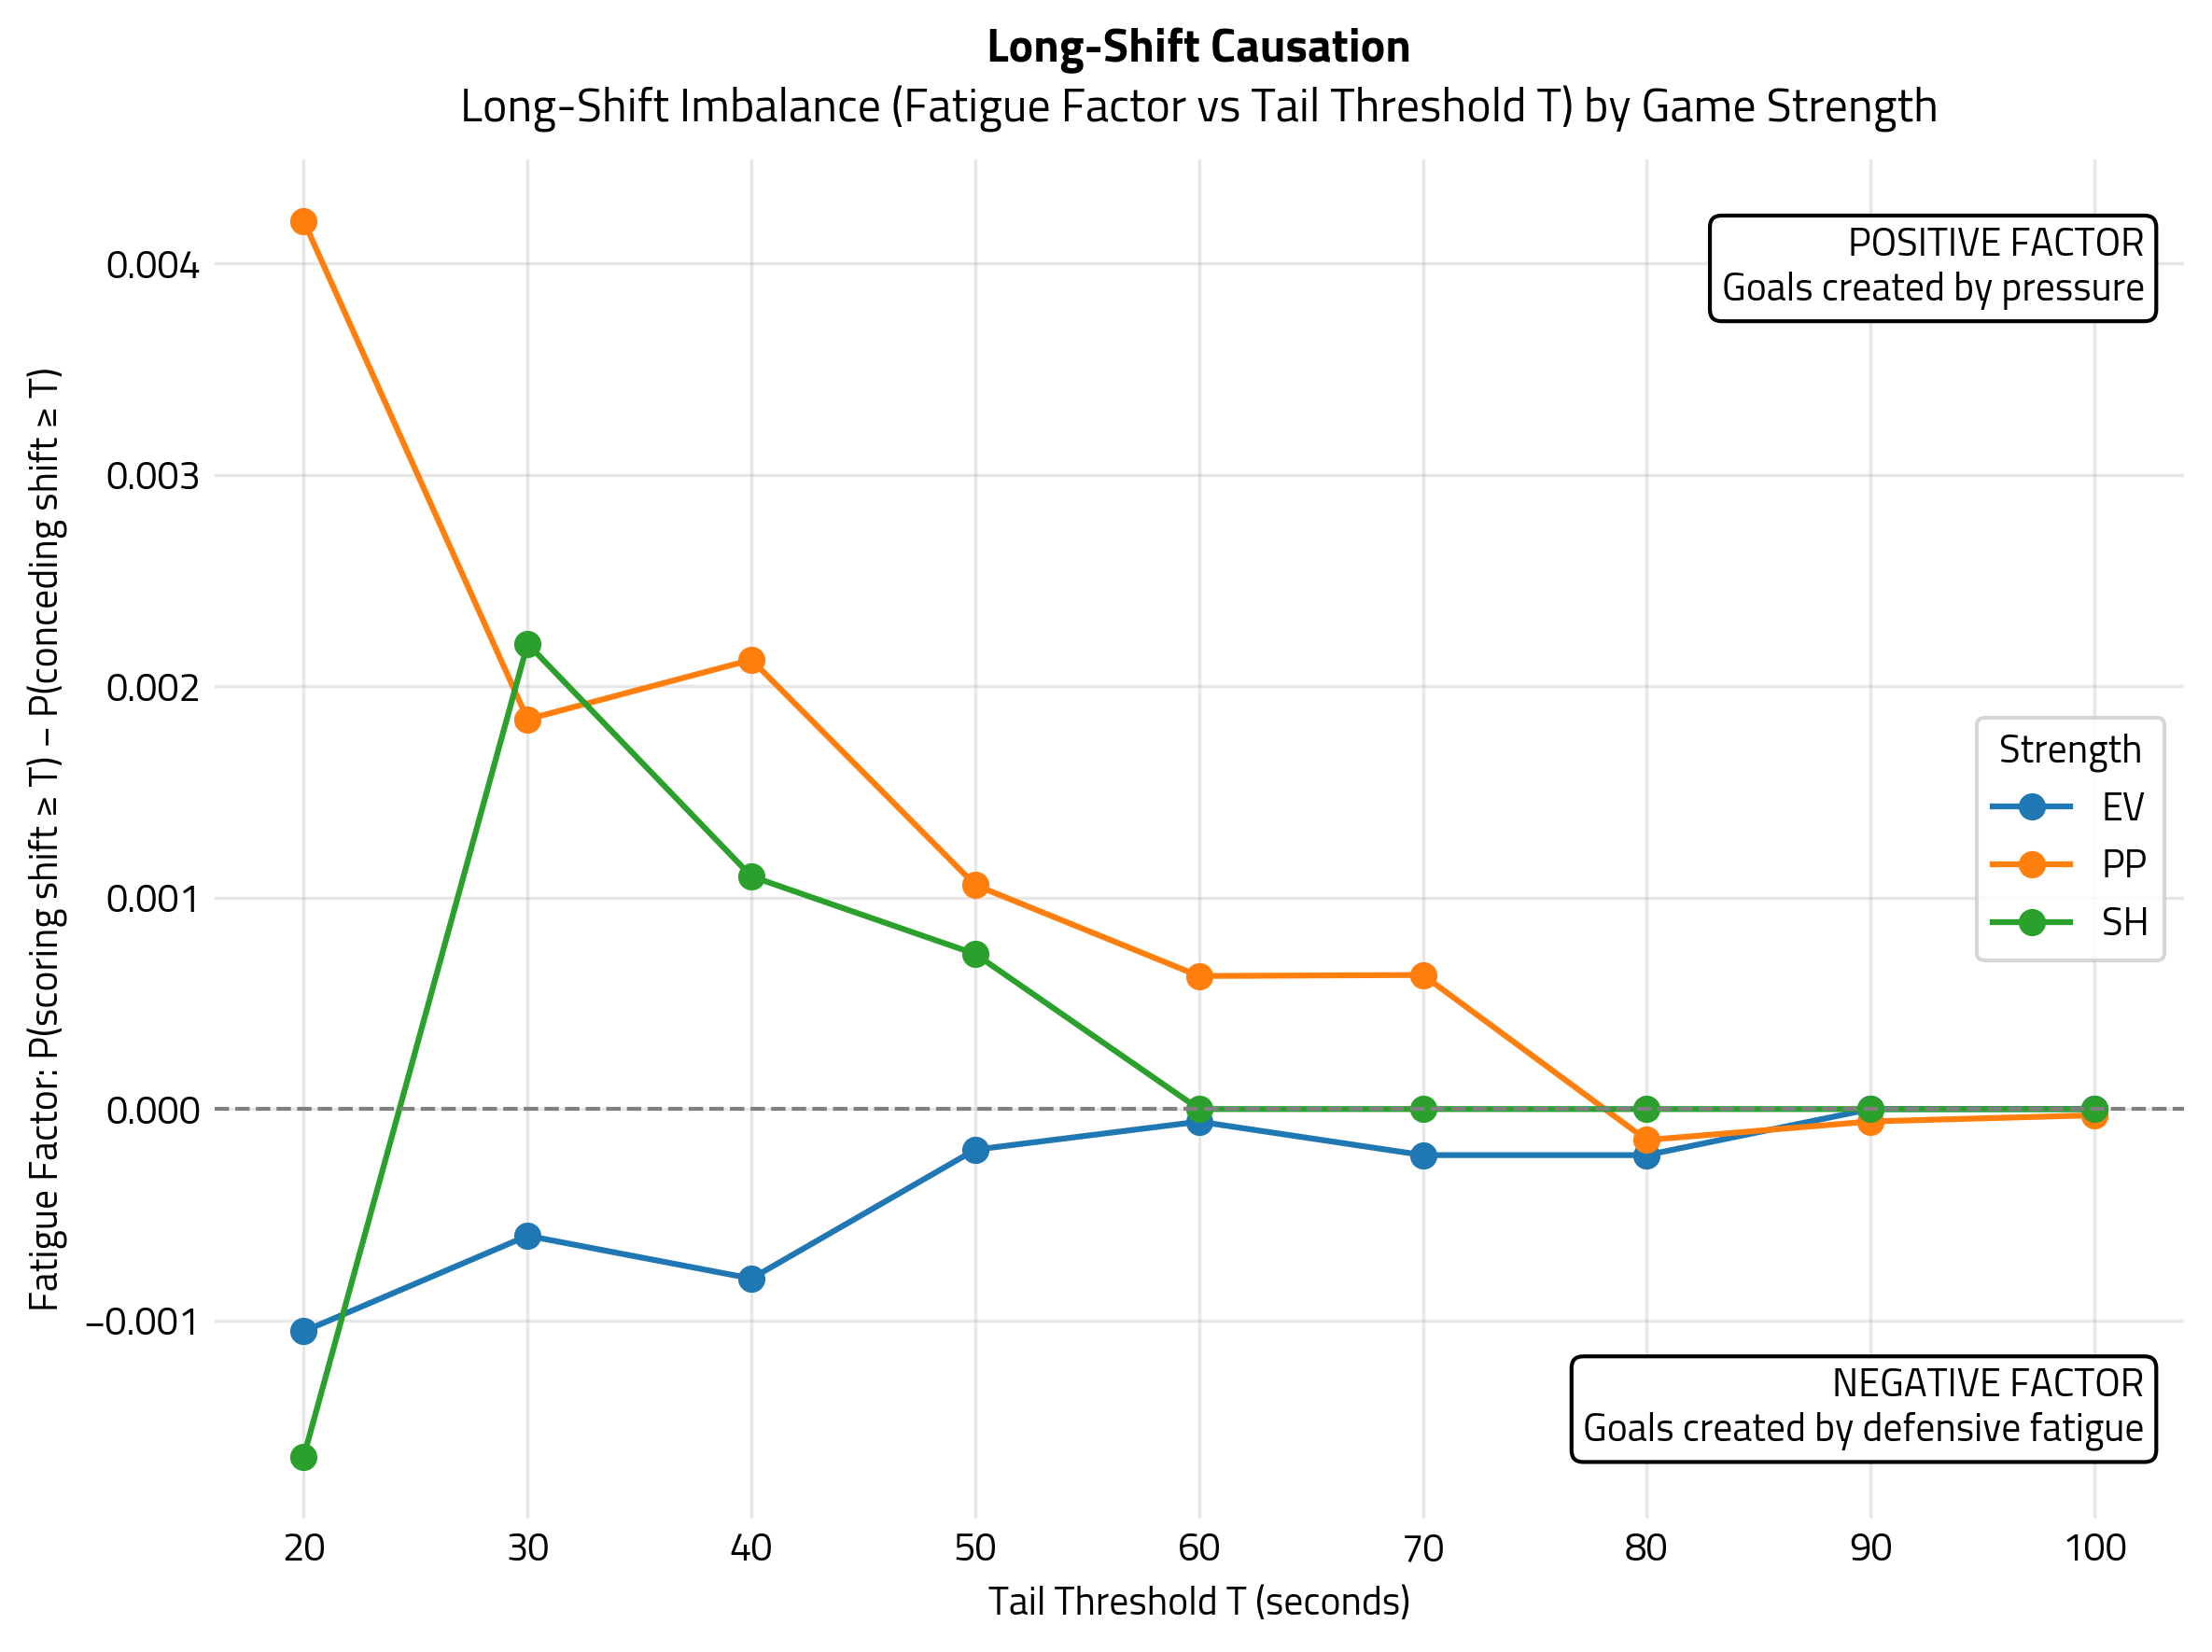
Here, the EV line close to 0 tells us that at even strength, most goals are scored when both teams have a very similar shift age. EV goals often come from transitions, broken plays, rushes, puck luck, or turnovers, so it wouldn’t be accurate to attribute them to fatigue or sustained pressure. On the Power Play, the pattern is much clearer: PP goals are driven by offensive pressure. As shifts get longer, the pressure effect naturally shrinks because long shifts are rare, but it never reverses into defensive fatigue. Short-handed results are noisy, which makes sense: SH shifts are short and SH goals are rare. SH data are volatile due to small samples.
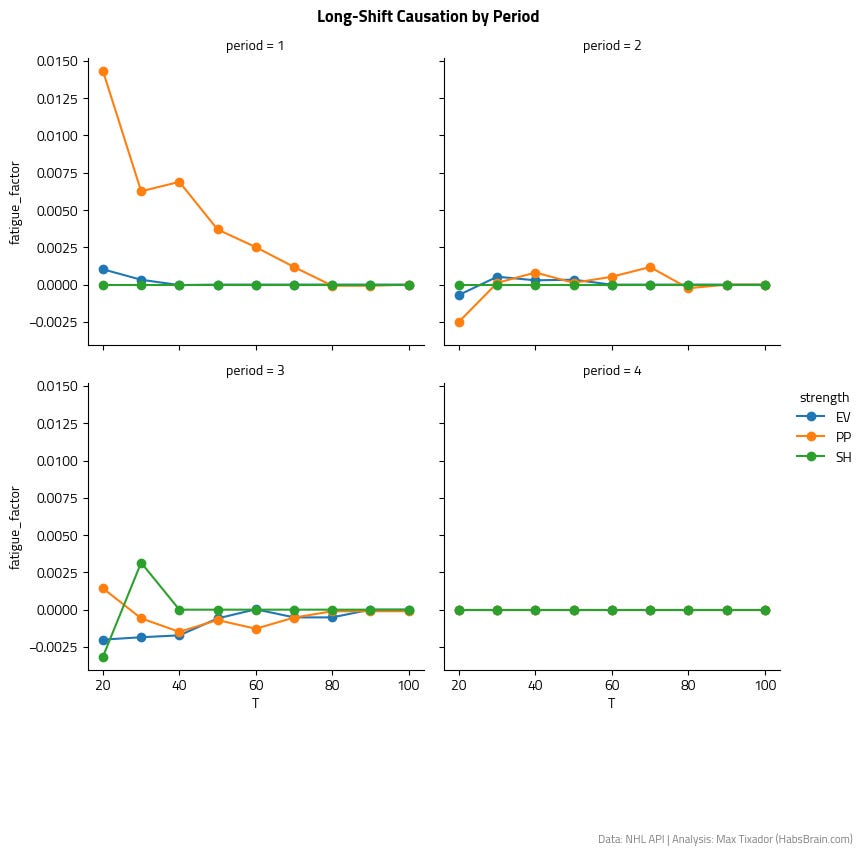
Can we learn something new when we add the periods to the variables we are already looking at? The answer is no. PP pressure is the only important signal, and it’s only in Period 1. Other than that, points and lines gravitate around 0 like flies around outdated food.
Coaches do a good job
To conclude, I finish writing the blog with more appreciation for hockey coaches. They are able to mitigate the impact of fatigue. In other words, fatigue does not create many goals.I looked for a link between fatigue and goals, and the data simply didn’t support it.
If you need to remember 5 things from my quick research:
Most NHL goals are scored early in a player’s shift
Shift Age difference rarely happens
After ~60s, conversion rate rises sharply at EV and PP. But, not a lot of shifts last that long.
Fatigue does not cause goals
PP shifts are longest; SH, the shortest; EV in the middle
There is plenty of room to expand the analysis. There would be additional value to look at players cumulated fatigue in the game as well as goalie fatigue. It would also be interesting to have much more consideration for the rare nature of goals in hockey. I feel that my analysis did not show enough consideration for that aspect. I also think the reader would have enjoyed more cool facts like a distribution of shifts lengths, team analysis, and other fun stats.
If you are still here, I hope you enjoyed this post. I tried to put some light on a concept that does not get much attention while giving a mix of hockey and statistical insights. This is meant to be a blog post for the nerdiest hockey fans. I started publishing my blogs to Linkedin, so I have colleagues and friends (who don’t watch hockey, but still want to support me), so I did my best to add context and explanations.
You can support me and my work, by giving me a follow on X.com and Bluesky, and by subscribing to the blog. Feel free to reach out if you want an introduction to analytics in hockey, I already helped multiple people for free. I also immensely appreciate feedback. You can also just chat with me, just to chat. I recently had the chance to talk with the creator of TheWinColumn and he was one of the best person I ever talked to. I think there are more really nice people out there, and the next “best person I ever talked” to might be you.
I will always be grateful to have thousands of people making the choice to listen to my hockey takes on a daily basis. I have a couple projects in the books. Enjoy the time leading to Christmas and happy holidays!
Love me a good violin chat
Very interesting! This lines up with what I looked at using average skating speed and distance travelled for full games compared to corsi and xG rates. NHL players are very good at conserving their energy throughout a game and are able to absorb longer shifts most of the time.