How often does the team who won on paper wins in real life?
How does xG relates with wins in NHL games
I did not thing I would write on this blog again this season. I thought the next time, I would write about hockey publicly, it would be under really different circumstances, but I will let the surprise marinate while I am working on what I have to work on to make my comeback in the world of weekly hockey newsletters (probably next season). I hope everyone is doing good. On my side, life is going really good, but it is also really, busy so I wanted to take a break of everything (midterms, projects, work, hobbies) to write a short article about something that on my mind for a couple of times now. I hope you like it.
Getting familiar with few terms
I think most of you are familiar with those terms, so it should go fairly quickly. I have this short glossary section because I was told to write articles like my mom (who does not know about hockey at all) would read it and it is also a way to all start on the same page.
Shots on goal
It is a shot that the goalie had to save or a goal. It does not include blocked shots (shot blocked by forward or defensman) or missed (shots that hit the post are missed shots per convention).
Corsi
Any shot attempt. Goal, miss, blocks, shots on goal. Any shot attempt.
Fenwick
Any unblocked shot attempt. Goal, miss, (no blocks), shots on goal. Any unblocked shot attempt.
Expected Goal (xG)
Probability that a shot attempt results in a goal based on a variety of characteristics.
In the public sphere (I don’t know what they are doing in the depths of the private sector unfortunately), Expected Goals are Fenwicks that were weighted for their shot quality.
How often does the team who won on paper wins in real life?
From far, I could not watch all Habs games but I am always following how good they are doing using my favourite stats websites. I noticed that the Canadiens are winning a lot of tight xG games and looking at it more, I was curious to see what was the outcome of Habs games based on their xG differential. But, it was not enough, I needed to know more. So I came up with a question that we will attempt answer together this article : How often does the team who won on paper wins in real life?
To define who was winning on paper, I am using the sum of xG (using HockeyR’s model) during the regular time (so non-OT and non-SO) of the regular season. The reason behind this choice of only using the first 60mins of regular season game is that I think there would be no OT if the game was won on xG during the regular time.
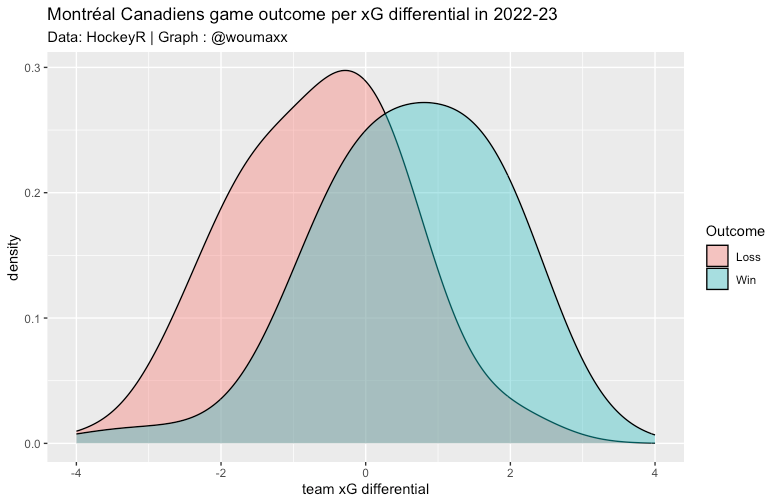
For the article, I am using the play-by-play data of last 3 seasons (2019-20, 2020-21, 2021-22) that I was able to gather using HockeyR. At the end of the article, I am using 2022-23 data because I thought people would be interested to see how the research can be applied to their team this season.
How xG relates with wins?
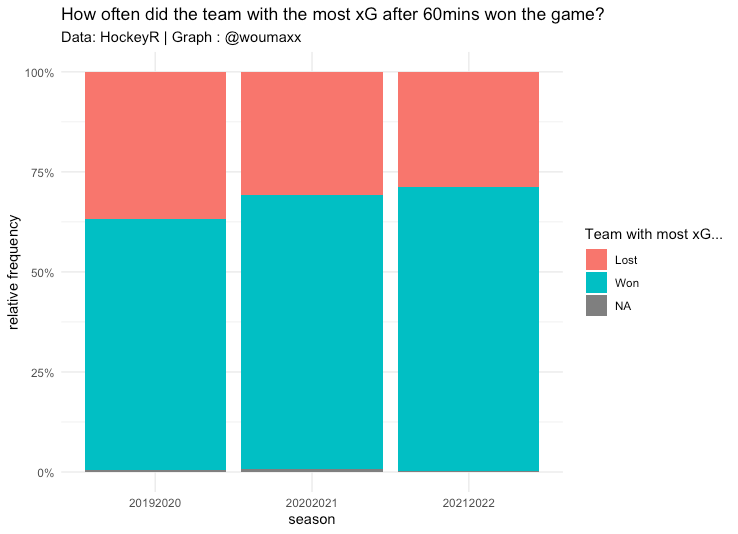
The team with most xG won the game 63% of the times in 2019-2020, 69% in 2020-2021, and 71% of the times last season. So, roughly, 2 games out of 3 were won by the team with the most expected goals.
In the legend of the graph, we see a NA label because in 15 occurrences, the home and away team had exactly the same amount of expected goals. It is something that should be rare since all xG values are numbers with 6 digits after the decimal point.
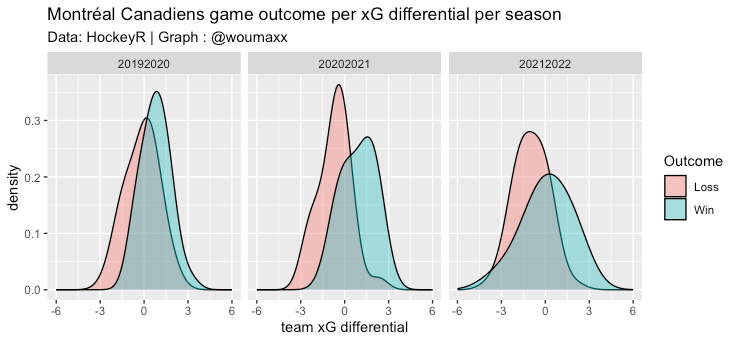
I thought you would be interested by how the Canadiens did in the last 3 seasons.
We can see that in the last 3 seasons, the Canadiens have lost good share of the tight xG games.
I am not satisfied, and I want to have a little bit of fun, so let’s build a simple linear model that guesses who won the game based on their xG differential after 60 minutes.
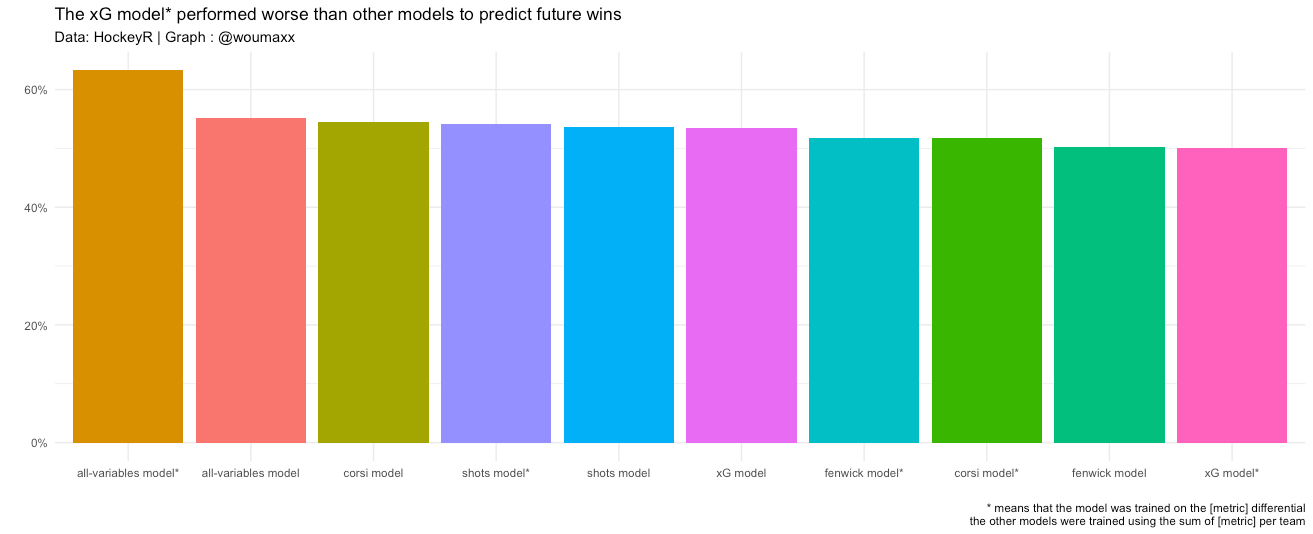
The model was actually worse than I expected. It guessed who won the game 50% of the times. I was expecting something closer to 66% since we saw earlier that teams who had the most xG won roughly 2 games out of 3.
To help with the fun, I made a variety of models to help predict who would win a game based on the sum of metric for both teams and with the metric differential. By example the corsi model uses home team corsi and away team corsi while the corsi model* uses the corsi differential between both teams. Those were really simple linear models as basic as you can build in R. The findings are actually really interesting. The Corsi model did better than all other models using only one metric. All models roughly had a similar performance (around 51%). The model who did the best (by a significant margin) was the model model using the differential of all variables.
Logically, it makes sense that the team with the most shot volume (and shot quality) does not necessarily win the game. Looking at metrics like shots on goal, shot attempts, unblocked shot attempts and expected goals, I completely ignore one aspect of the game that can have a big impact on the outcome of the game : goaltending. When the opposing goalie has a good night, you can have the best offensive chances in the world, but you might still leave the game with a loss. The opposite scenario also exists. When a goalie has a “stinger”, your team can play good defense but if the goalie is a swiss cheese (allows a lot of goals on few shots), you will end up with a loss and you won’t have much power on it.
What does that mean for the Canadiens
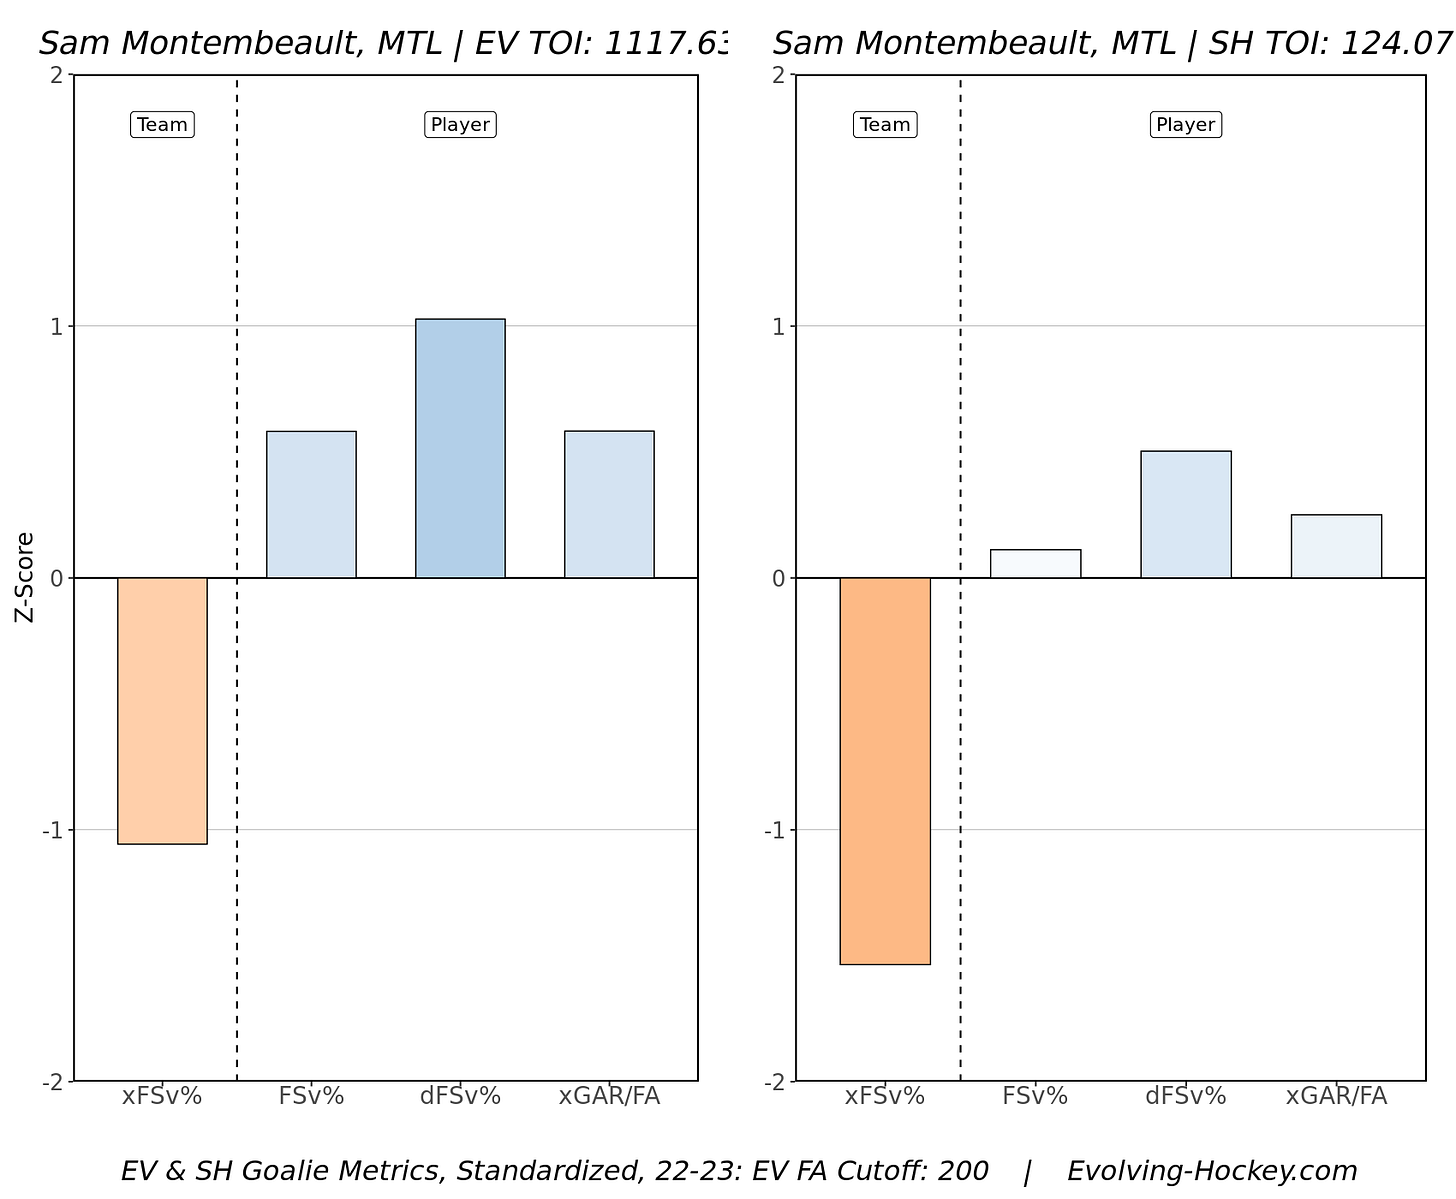
The Canadiens still have a losing record, but they generally win the games where they have the edge in xG. They have also won a good share of games where they generated less quality than their opponents, thanks to clutch offensive goals by Cole Caufield or clutch goaltending by Samuel Montembeault.
Closing thoughts
Before writing the article, I thought that winning the game on paper was attempting more shots and having more expected goals than the opposing team. My theory had a major issue : it implies that only skaters (forwards and defensemen) have an impact on game outcome. I mentioned that goalies could have an impact on game outcome, but let’s not forget about coaches and referees. I think that by playing different combinations of players together and matching different players with opposing players, coaches have an impact on game outcome. Referees have a neutral role in the game, but it does not mean that they have a neutral impact on the game. They are the ones enforcing the rules and calling the stoppages of play. Their actions can have major repercussions on the momentum of the game and eventually the outcome of the game. Calling a penalty late in the the 3rd period of a tie can change the script of how the game will end.
I thought winning on paper was winning the xG battle, but I think there is a lot more in “winning on paper” now that i think about it.
Acknowledgements
Dan Morse, the person behind HockeyR
MoneyPuck.com (for their Deserve to win -o- meter) for inspiring this piece


